Troubleshooting Cisco Network Elements with the USE Method
The USE Method is a model for troubleshooting a system that is in distress when you don't know exactly what the nature of the problem is.
For example, if users within a specific part of your network are complaining of slowness, disconnects and poor application performance, you can probably isolate your troubleshooting to 2-3 switches or routers. However, since the problem description is so vague (we all love the "it's slow!" report, right? ?), it's hard to know where to start with detailed troubleshooting on those specific switches/routers.
That's where the USE Method comes in.
I learned about the USE method while reading Brendan Gregg's blog. Brendan is a very skilled performance engineer specializing in UNIX systems. To quote Brendan:
The USE Method can be summarized as: For every resource, check utilization, saturation, and errors.
- Resource: all physical [network element] functional components (eg, CPU, memory)
- Utilization: the average time that the resource was busy servicing work
- Saturation: the degree to which the resource has extra work which it can't service, often queued
- Errors: the count of error events
In this post, I adapt the USE Method to Cisco network devices and show how their physical resources (CPUs, different areas and types of memory, interfaces, and more) can be methodically examined in the three dimensions of utilization, saturation, and errors. Be sure to read Brendan's blog post to understand the logic behind the USE Method and to gain insight into how to apply it.
Table of Contents⌗
- Routers (ISRg2, ISR 4000, ASR 1000, CSR 1000V) running IOS or IOS-XE
- UADP-Based Catalyst Switches (3650, 3850, 4500E Sup8E) running IOS-XE
- Catalyst 6500/6800 Series
Routers (ISRg2, ISR 4000, ASR 1000, CSR 1000V) running IOS or IOS-XE⌗
The different colors denote the grouping of physical components.
|
Component
|
Type
|
Metric
|
|
Control Plane CPU
|
Utilization
|
show proc cpu: "CPU utilization for five seconds: 5%/1%; one minute: 4%; five minutes: 2%"
General CPU business
5%/1% — 5% total/1% time spent in interrupt context (CEF switching)
show proc cpu history: histograms; where was the CPU at X seconds/minutes ago? What was peak vs average?
|
|
Control Plane CPU
|
Saturation
|
show proc cpu extended: Run queue lengths, response times
show logg | inc CPUHOG: Is a process sitting on the CPU too long, not willingly giving it up?
|
|
Control Plane CPU
|
Errors
|
?
|
|
Control Plane Memory
|
Utilization
|
show proc memory: used/free
"Processor" memory is for IOS, processes, etc
"I/O" memory is for storing packets while they're being switched through the box
show proc memory sorted: process hogging memory? process memory leak?
|
|
Control Plane Memory
|
Saturation
|
show buffers, show buffers failures: allocation failures, "no memory" failures
show logg: malloc errors
|
|
Control Plane Memory
|
Errors
|
show logg
Execute Generic Online Diagnostics (GOLD) tests:
|
|
Data Plane
(ISR 4k, ASR 1k, CSR1000V)
|
Utilization
|
show platform hardware qfp active datapath utilization
The aggregate in/out data plane utilization
|
|
Data Plane
(ISR 4k, ASR 1k, CSR1000V)
|
Errors
|
show platform hardware qfp active statistics drop detail
Packet drop reasons and counters
|
UADP-Based Catalyst Switches (3650, 3850, 4500E Sup8E) running IOS-XE⌗
The different colors denote the grouping of physical component.
|
Component
|
Type
|
Metric
|
|
Control Plane CPU (IOS-XE/Linux processes)
|
Utilization
|
show processes cpu detailed
show processes cpu detailed | exclude 0.00 (processes with non-zero CPU utilization)
|
|
Control Plane CPU (iosd threads)
|
Utilization
|
show processes cpu detailed process iosd sorted
|
|
Control Plane CPU
|
Saturation
|
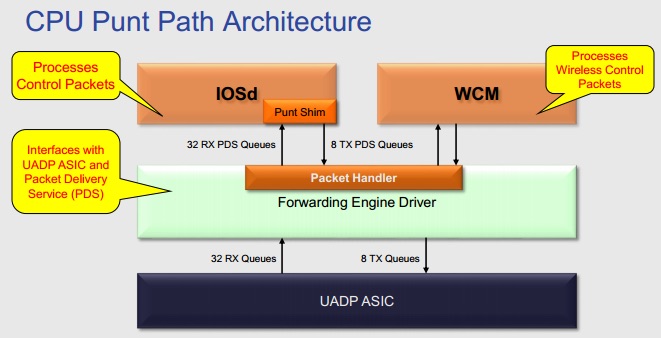
show platform punt statistics port-asic 0 cpuq -1 direction rx
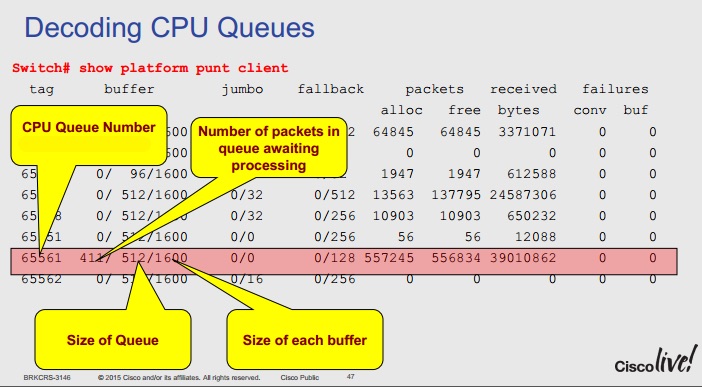
show platform punt client
show pds tag all | include Active|Tags|
show platform punt tx
show logg | inc CPUHOG: Is a process sitting on the CPU too long, not willingly giving it up?
|
|
Control Plane CPU
|
Errors
|
?
|
|
Control Plane Memory (IOS-XE/Linux processes)
|
Utilization
|
show processes memory sorted (sorts by RSS, descending)
|
|
Control Plane Memory (iosd process memory)
|
Utilization
|
show processes memory detailed process iosd sorted
|
|
Control Plane Memory
|
Saturation
|
show buffers: allocation failures, "no memory" failures
show logg: malloc errors
|
|
Control Plane Memory
|
Errors
|
show logg
Execute Generic Online Diagnostics (GOLD) tests:
|
|
Data Plane TCAM
|
Utilization
|
show platform tcam utilization asic all
|
|
Data Plane TCAM
|
Saturation
|
show logg (look for messages indicating TCAM is full: MAC addresses can't be learned; ACEs cannot be installed in hardware)
|
|
Data Plane TCAM
|
Errors
|
?
|
Catalyst 6500/6800 Series⌗
The different colors denote the grouping of physical components.
|
Component
|
Type
|
Metric
|
|
Control Plane CPU
|
Utilization
|
show proc cpu: CPU utilization for five seconds: 5%/1%; one minute: 4%; five minutes: 2%
General CPU business
5%/1% — 5% total/1% time spent in interrupt context (CEF switching)
show proc cpu history: histograms; where was the CPU at X seconds/minutes ago? What was peak vs average?
|
|
Data Plane (Switch Fabric)
|
Utilization
|
show fabric utilization all
|
|
Data Plane (Switch Fabric)
|
Errors
|
show fabric channel-counters
|
|
Data Plane (TCAM)
|
Utilization
|
show platform hardware capacity pfc
show tcam counts
|
|
Data Plane (TCAM)
|
Saturation
|
show platform hardware capacity pfc
show tcam counts
|